A complete SQL based Data Warehouse pipeline from ingestion to insights
Comprehensive data warehousing and analytics project, from building a data warehouse to generating actionable insights
Introduction
In this project, I built a SQL-based Data Warehouse following the Medallion Architecture (Bronze-Silver-Gold) to design a scalable, analytics-ready data solution. The goal was to transform raw CSV datasets into clean, structured, and business-focused insights using SQL Server.
The project covers the end-to-end data engineering workflow from ingestion and transformation to data modeling and analytics showcasing how to build a modern data warehouse using only SQL-based processes. Through this implementation, I gained hands-on experience with ETL pipelines, star schema design, and SQL-driven reporting, creating a foundation that can easily integrate with tools like Power BI for advanced visualization.
Phase 1: Data Architecture
Designing a Modern Data Warehouse Using Medallion Architecture Bronze, Silver, and Gold layers.
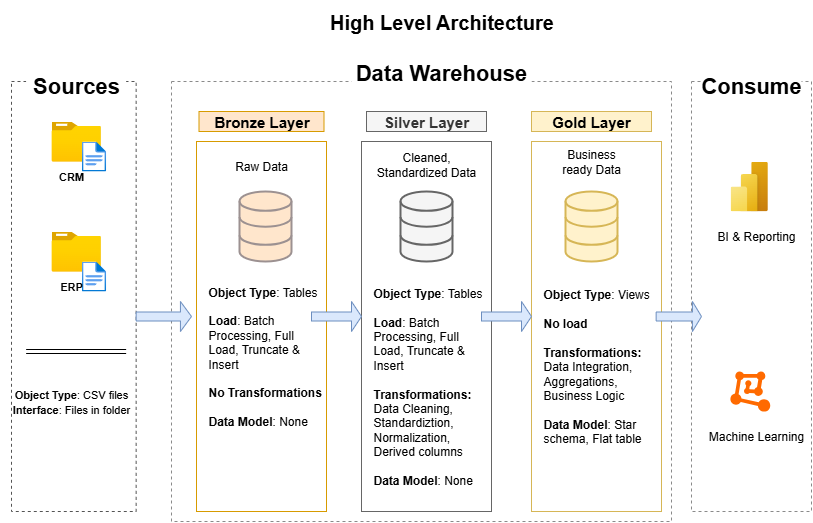
- Bronze Layer: Stores raw data as-is from the source systems. Data is ingested from CSV Files into SQL Server Database. In this layer I create schema for the data and then load csv files into it as raw data.
- Silver Layer: This layer includes data cleansing, standardization, and normalization processes to prepare data for analysis. I create a stored procedure for easy to use of sql query. First we truncate the data then add our data into the table for freshness.
- Gold Layer: Houses business-ready data modeled into a star schema required for reporting and analytics. In this particular layer I create a fact and dimentions tables.
Access the require scripts from here.
Phase 2: ETL Pipeline
Building an automated ETL (Extract, Transform, Load) pipeline to move data efficiently through the Medallion layers from raw ingestion to analytics-ready datasets.
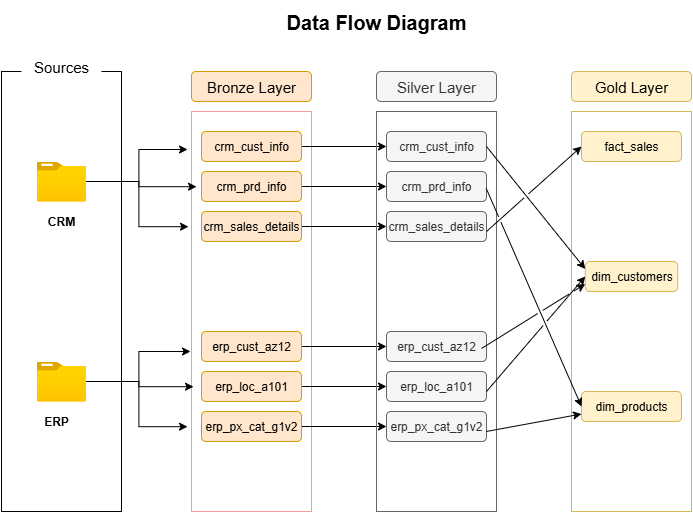
- Extract: Data is extracted from CSV sources stored locally and ingested into the Bronze Layer using SQL Server scripts. These scripts define the schema and automate the data import process to ensure consistency across different datasets.
- Transform: In the Silver Layer, transformation logic is applied to clean and standardize the data. This includes handling missing values, data type conversions, and creating relationships between tables. I used stored procedures to automate truncation and reloading of tables, ensuring fresh and accurate data for each run.
- Load: Finally, in the Gold Layer, the transformed data is loaded into fact and dimension tables following the Star Schema model. These tables are optimized for analytical queries and Power BI dashboards, enabling faster insights and efficient reporting.
Phase 3: Data Modeling
Designing a Star Schema data model to structure the Gold Layer for efficient reporting and analytics. This model simplifies querying by separating business processes (facts) from descriptive attributes (dimensions).
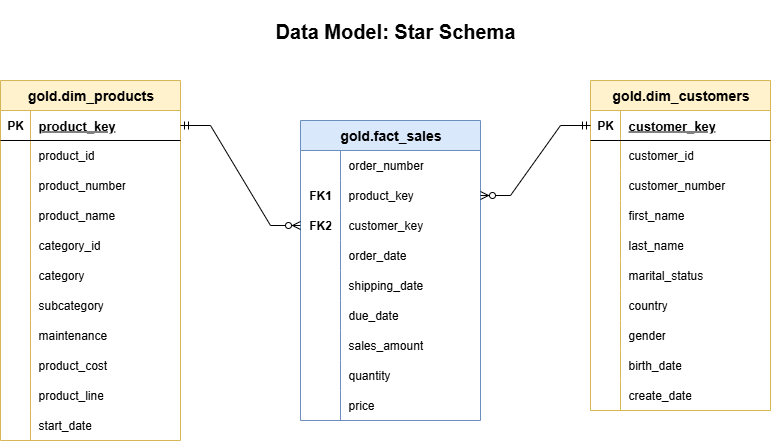
Fact Table -
gold.fact_sales: Contains measurable, quantitative data about business transactions such assales_amount,quantity, andprice. It also includes foreign keys linking to the product and customer dimension tables.Dimension Table -
gold.dim_products: Stores product-related attributes likeproduct_name,category,subcategory, andproduct_line. This enables detailed product-level analysis and filtering in Power BI reports.Dimension Table -
gold.dim_customers: Includes customer-centric attributes such asfirst_name,last_name,gender,country, andmarital_status, allowing demographic segmentation and customer behavior analysis.
By connecting these tables through foreign key relationships, the Star Schema ensures optimized query performance and simplified analytics for reporting tools.
Phase 4: Analytics & Reporting
Once the Gold Layer was established, I created SQL-based analytical reports to extract meaningful business insights directly from the data warehouse. These reports help in understanding key performance indicators such as sales trends, customer behavior, and product performance.
Exploratory Data Analysis (
exploratory_data_analysis.sql): Focuses on understanding the overall sales performance and identifying data patterns across customers and products. This step helps validate data accuracy and consistency within the Gold Layer.Customer Report (
customers_report.sql): Generates detailed insights about customer demographics and purchasing behavior — including total sales by country, gender-based segmentation, and high-value customer identification.Product Report (
products_report.sql): Analyzes product-level performance metrics such as top-selling categories, subcategories, and contribution margins. This assists in strategic product planning and marketing decisions.Advanced Analytics (
advanced_analytics.sql): Delivers higher-level business intelligence by calculating metrics like average order value, customer lifetime value (CLV), and sales growth trends over time. These reports support forecasting and executive decision-making.
All reports are powered by SQL queries executed on the Gold Layer, leveraging its optimized Star Schema design for fast and efficient analytics.
You can access the full report scripts here.
Conclusion
This project demonstrates the complete lifecycle of building a modern SQL based Data Warehouse using the Medallion Architecture (Bronze-Silver-Gold). From raw data ingestion to structured modeling and advanced analytics, each phase was carefully designed to ensure scalability, data quality, and performance.
By combining ETL automation, star schema modeling, and SQL-driven analytics, I built a robust foundation for data-driven decision-making capable of powering dashboards, executive reports, and predictive models. The modular design ensures that each layer (Bronze, Silver, and Gold) can be independently scaled or enhanced as new data sources and business needs emerge.
Ending Note
This project was a valuable learning experience in data engineering and analytics, helping me understand how to transform raw data into actionable insights using SQL.
I’ve shared the complete code, scripts, and documentation publicly so others can explore, modify, or extend the workflow for their own learning.
Explore the full project from here.
Connect me on Threads Linkedin
Check out my resume